|
|
Satellite Imagery- Hurricane Sector - |
|
|
- - click on image for animation - -
|
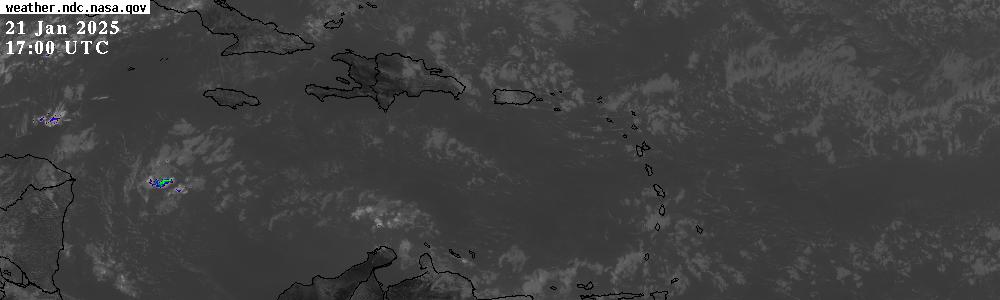
The above GOES-13 satellite image is created with the Interactive Weather Satellite Viewer at NASA's Global Hydrology and Climate Center and is updated every 30 minutes (EDT = UTC - 4 hours). Below as well Meteosat Satellite Images of the central Atlantic. These will show waves coming from the African Coast can become the infamous 'Cape Verde storms' or the next big one for the Caribbean islands... Also below, an image of current sea surface temperature. Hurricanes get their energy from warm water. The water usually has to be at least 80F to be able to fuel a hurricane. Is it warm enough yet? |
- - Two and Five Day NHC Tropical Weather Outlook - -

- - More GOES (Central Atl., Caribbean, Gulf+Eastern US) - -
- - GOES Caribbean + Central Atlantic (Infrared - Clouds/Rain Intensity) - -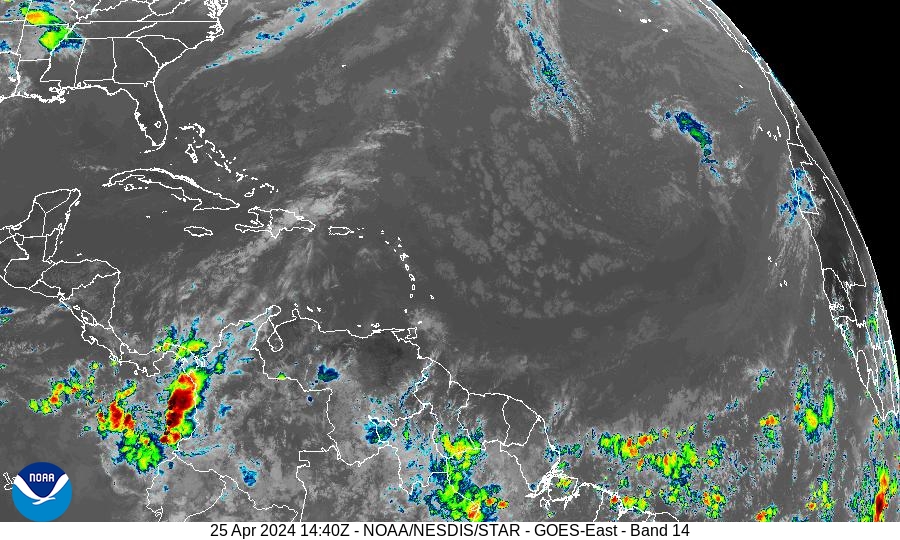
- - Click on image for different sizes and other bands - -
- - GOES Caribbean (Infrared - Clouds/Rain Intensity) - -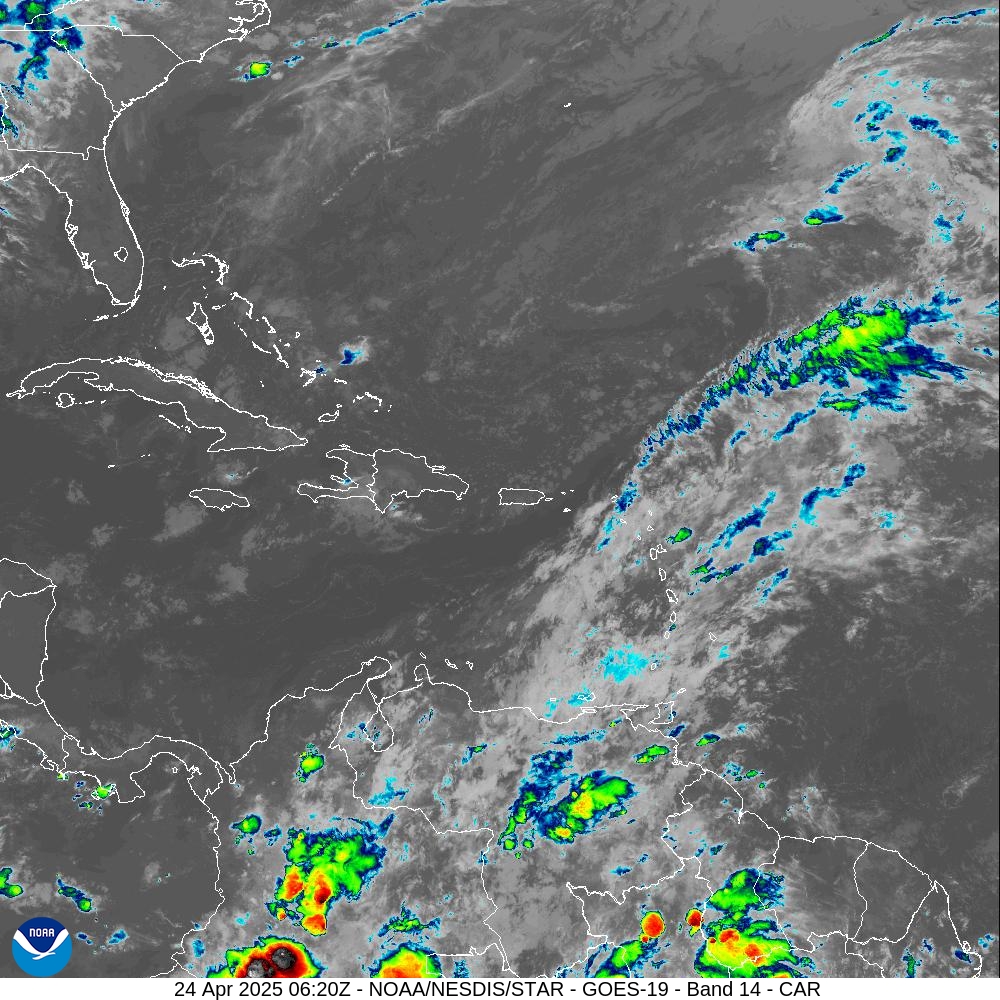
- - Click on image for different sizes and other bands - -
- - GOES Caribbean (Quasi True Color) - -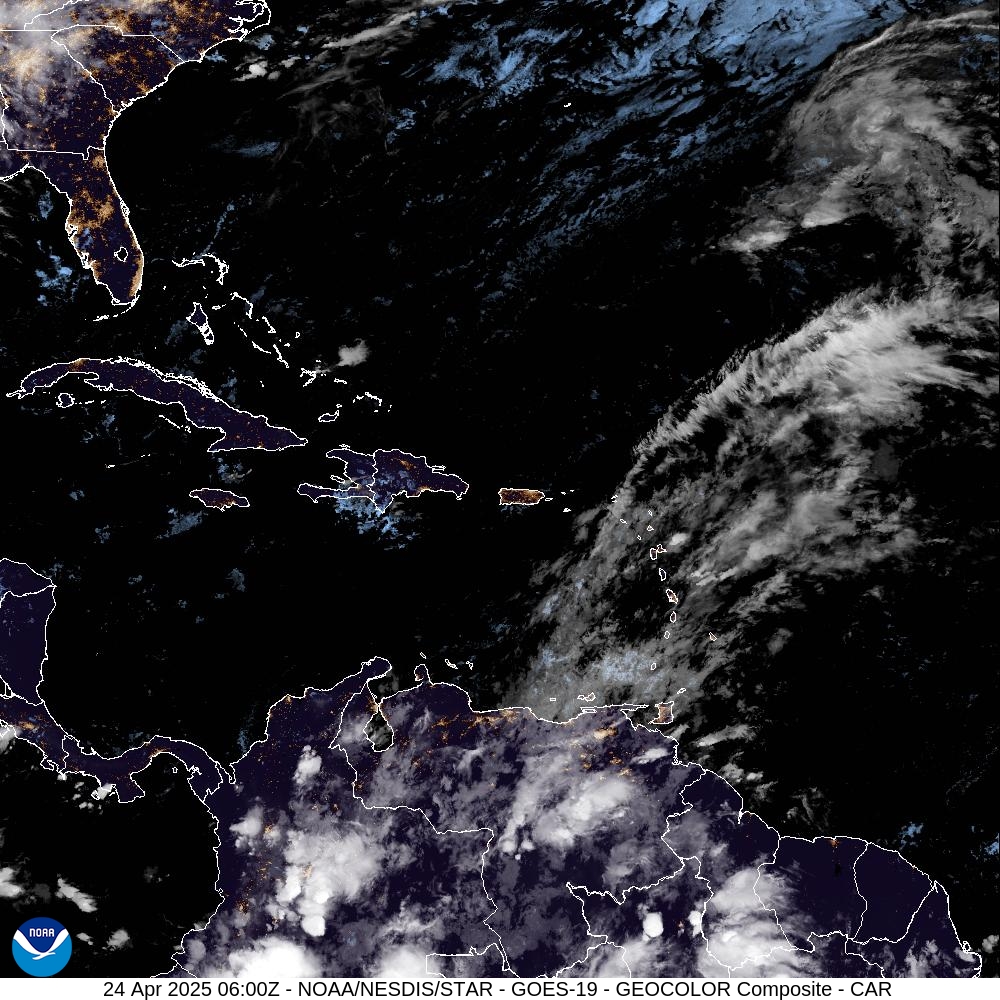
- - Click on image for different sizes and other bands - -
- - G O E S - -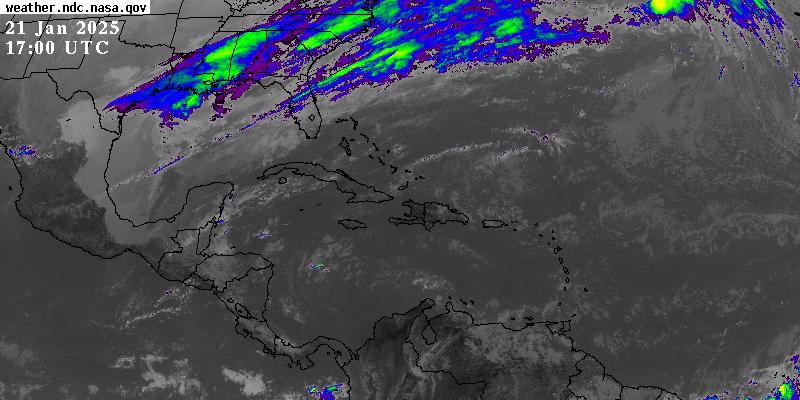
- - Click on image to create different projections, zoomed images and loops!
- - Tropical Waves - -
Although not a satellite image, the so-called Unified Surface Analysis below, shows among other things the location of tropical waves, high/low temperatures, windspeed and direction, the ITCZ, fronts and high and low pressure systems. Comparing it for example to the satellite image below shows how much convection is associated with those waves or low pressure systems. It is produced by the Ocean Prediction Center (NOAA/NCEP). I cropped the original image, full size can be retrieved by clicking on it.
- - Unified Surface Analysis (NOAA/NCEP) - -
- - Click on image for full resolution - -
- - Waves from African Coast - -
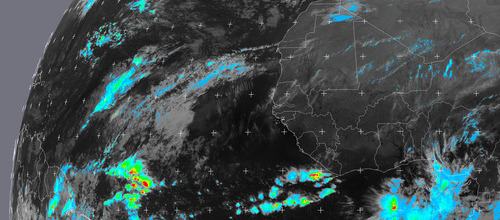
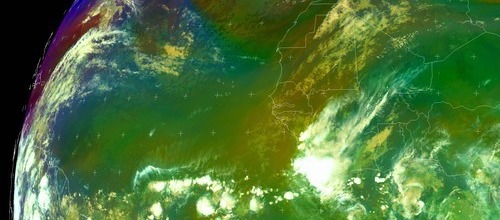
Below the most recent combined Meteosat-SSM/I H03B (Multi-sensor Precipitation Rate at ground) and Meteosat Airmass product, focussing on any waves coming off the African coasts. These waves have the potential to develop into hurricanes. Updated every 30 minutes (MPE) or 60 minutes (Airmass). More information on these products on the EUMETSAT Website. Image Copyright EUMETSAT. Bottom image is a Meteosat Pseudo Natural Color image showing clouds (source: CIMSS Tropical Cyclones Group, U. Wisc.).
|
- - Precipitation Rate (H03B) - - |
 |
|
- - Air Mass - - |
 |
- - click on images for animation - - |
- - Pseudo Natural Color - -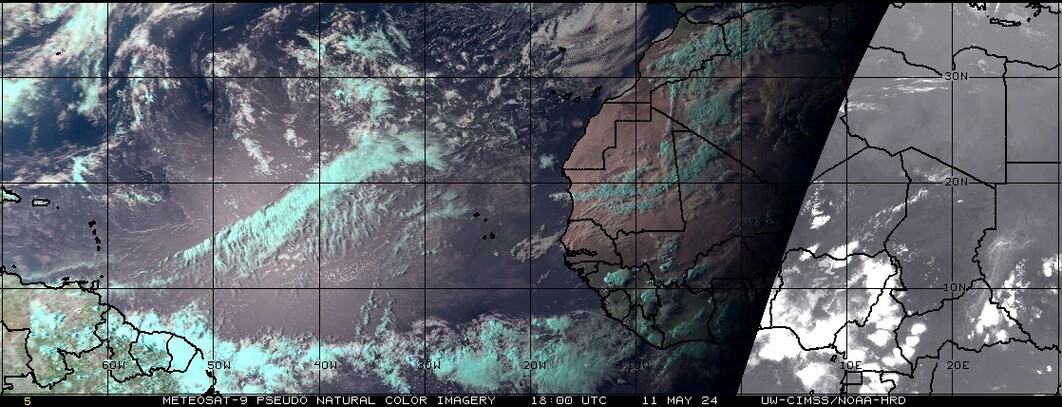
- - Click on image for movies and other info - -
- - Saharan Air Layer (SAL) - -
The Saharan Air Layer (in red below) is a very dry air-mass coming from the African continent. Because it is so dry it can inhibit the formation and/or intensification of tropical storms. See also: NOAA's Hurricane FAQ. Source original image: CIMSS at University of Wisconsin-Madison, below my cropped version to accentuate the Atlantic.
- - Saharan Air Layer - -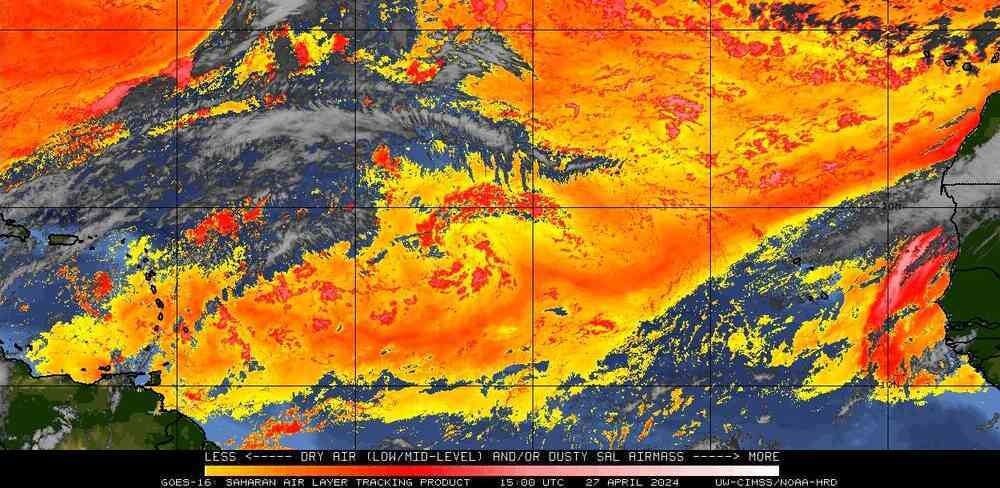
- - Click on image for movies and other info - -
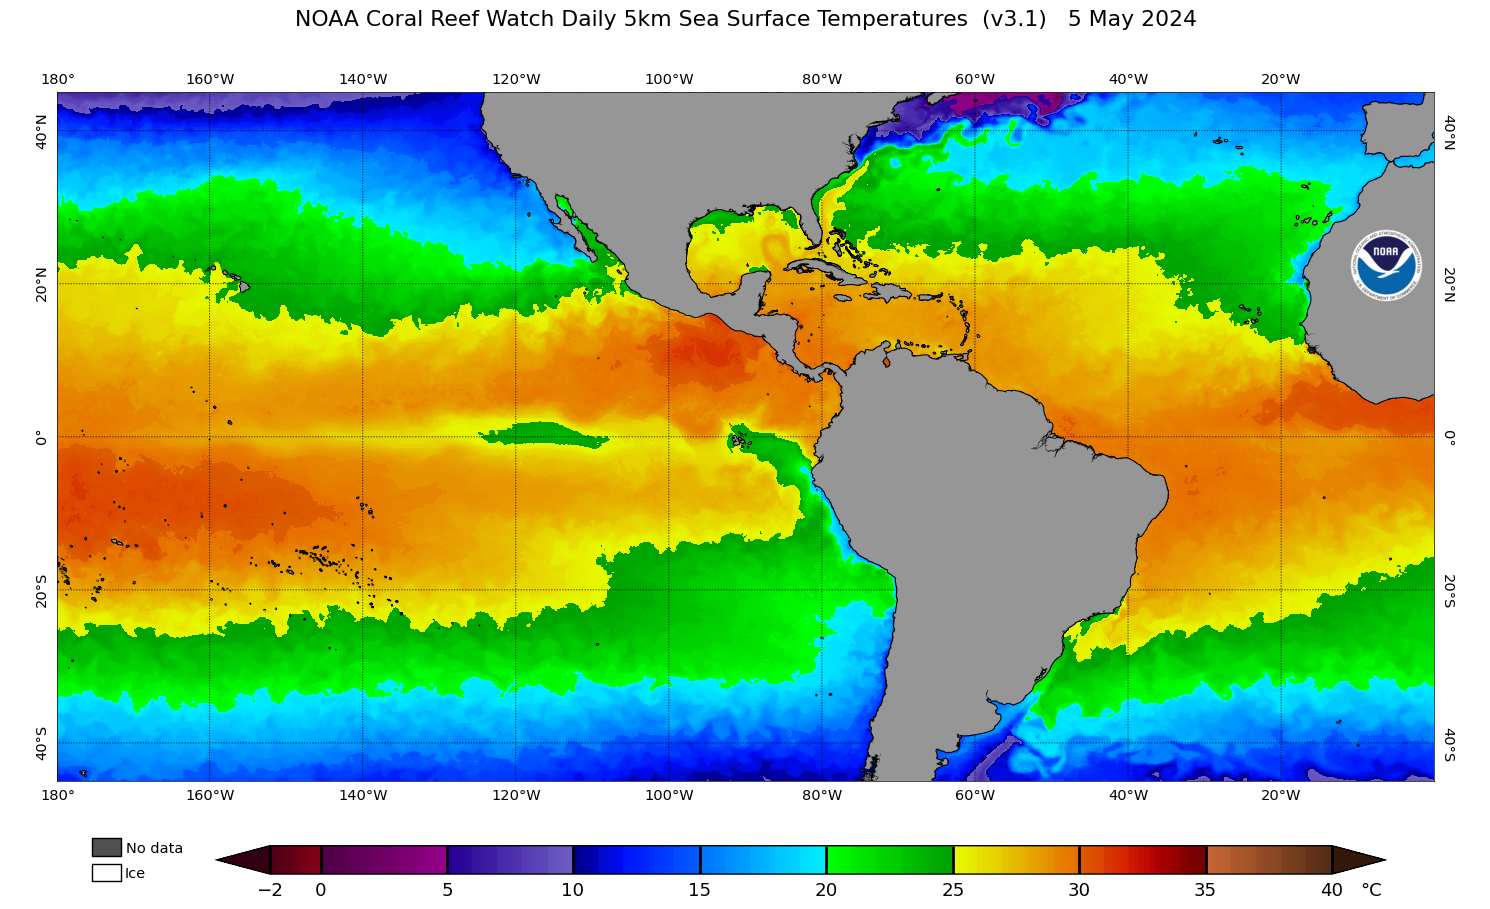
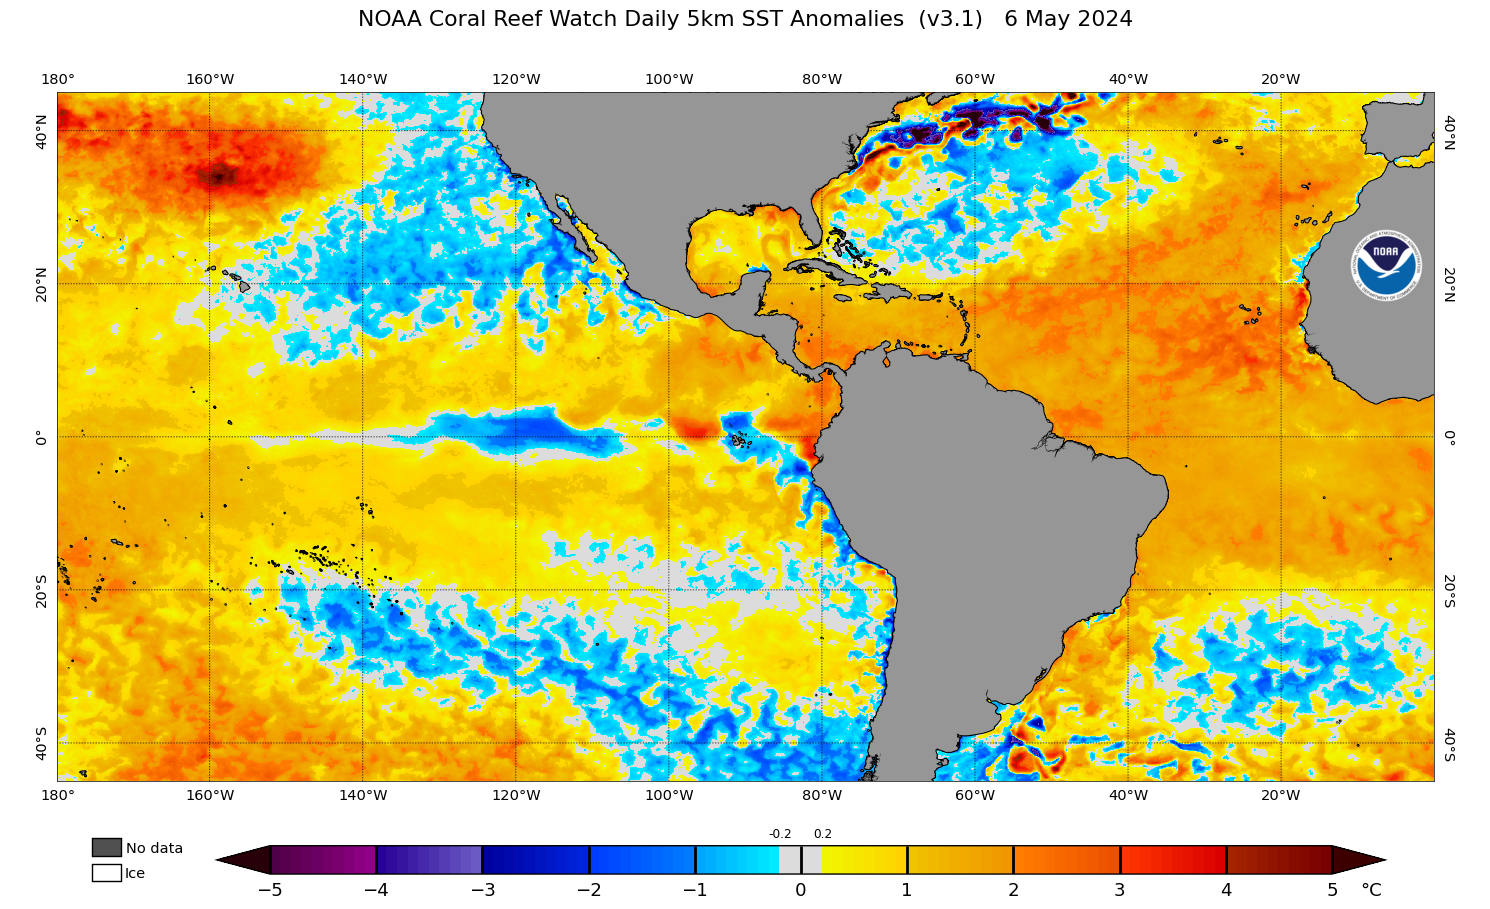
- - Sea Surface Temperature + Anomaly - -
Hurricanes are fueled by the heat energy of the oceans. Typically waters need to be above 80F (25.5C) to form or sustain itself. The warmer the water the more energy is stored in them, and the stronger a hurricane can get. The 'anamoly' image shows how much warmer or colder it is to normal. Image source: NOAA Coral Reef Watch
 |
 |
Note: Weather satellite data (except SST-map) courtesy of the Global Hydrology and Climate Center in Huntsville Alabama, NOAA/NESDIS and EUMETSAT.
| Back to top |