|
|
Climatologyof Caribbean Hurricanes |
|
|
Weekly analyses of tropical systems passing within 60nm (= 69mi.) of the island. Used latitude/longitude coordinates (19.28N, 81.35W) might not be the center of the island. Often the location of the island weather station was used, which is normally at the airport.
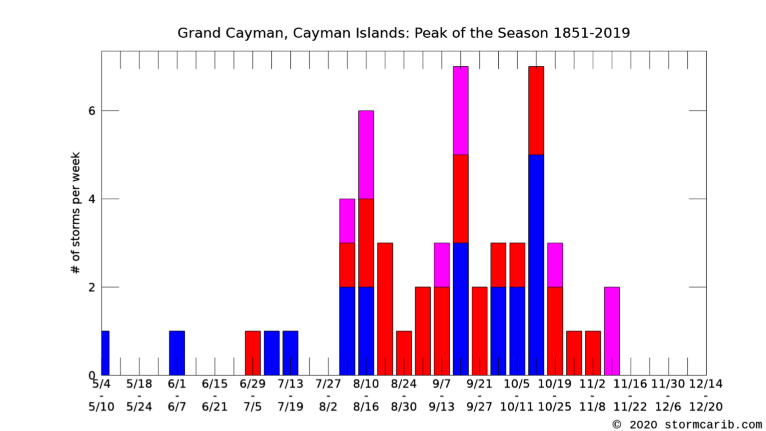
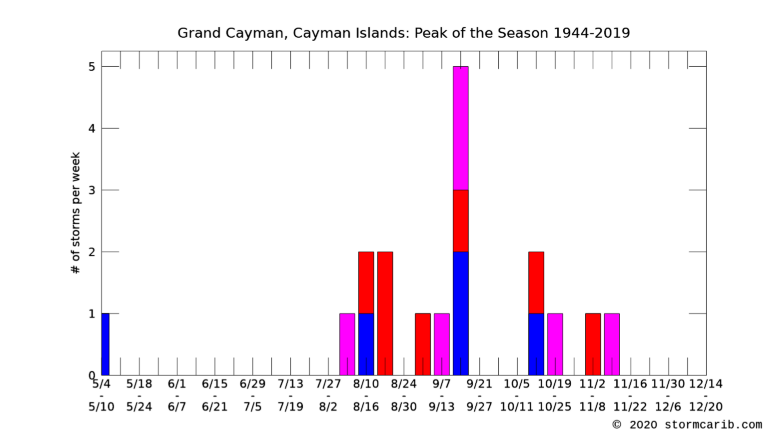
In the two graphs below are the total number of tropical systems plotted which were passing by for each seven day period since 1851 or since 1944 through 2019. So it can be easily seen which part of the year is most active. Those tropical systems reaching hurricane strength are in red, and the 'big ones' (major hurricanes, or category 3 and up) in purple. A summary below the graph shows during which week of the year the most number of tropical storms passed by, as well as the peak of the season for hurricanes and major hurricanes. Between brackets the number of storms during that week, and the probability of it occurring (for example, if 2 hurricanes came close during that week over 10 years, the probability of a hurricane passing by for that specific week is one every 5 years).
See how this compares to all Atlantic storms, or for the Eastern Caribbean, Western Caribbean or the Bahamas/Turks&Caicos regions.
A separate part of the climatology section contains the actual storm tracks (all or per decade) and a 5 year analysis to find out if more storms have passed by Grand Cayman lately. See also how Grand Cayman ranks among other islands.
Period: 1851 - 2019
category 3-5 hurricanes: purple; category 1-2: red; tropical storms: blue
 | |
|
Period: 1944 - 2019
category 3-5 hurricanes: purple; category 1-2: red; tropical storms: blue
 | |
|
Grand Cayman, Cayman Islands: all dec peak 5yr rank
Copyright © 2020 Caribbean Hurricane Network. All Rights Reserved
| Back to top |